Python for Data Analysis: Pandas
Basic
3 min readAug 12, 2020
Tool review
Anaconda?
- Python + Libraries + I/O Program
Jupyter Notebook
- Python Debugging Tool
Pandas Data Structure
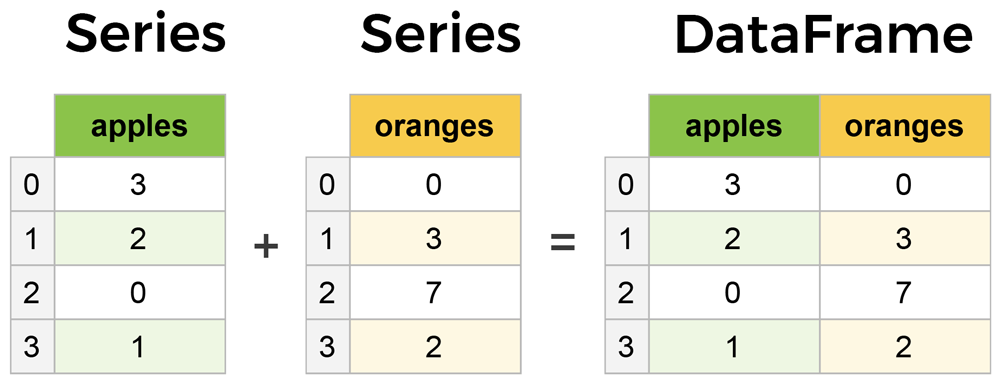
columns = [‘apples’, ‘oranges’]
index = [0,1,2,3]
Pandas Basic Commands
- Importing data: read_excel(), read_csv()
- Selection: df.loc(), df.iloc()
- Changing index/column: columns/index, reset_index()
1. Importing pandas
import pandas as pd2. Importing data
pd.read_excel('<filepath> + <filename>.xlsx')
pd.read_csv('<filepath> + <filename>.csv')
Filepath can be written either in absolute path and relative path.
- For relative path, “./” -> means current jupyter notebook file location
Example:
fpath = './data/exam.xlsx'
raw = pd.read_excel(fpath)#shows the upper part of the data up to 5 items
raw.head()#shows the bottom part of the data up to 5 items
raw.tail()#shows the first item of the data
raw.head(1)#shows the amount and type of the index/column data
raw.info()#shows the basic statistics for each column
raw.describe()#set the certain column to be index
raw.set_index('index')#assign the index when importing data
pd.read_excel('filename', index_col = <column_info>)fpath = './data/exam.xlsx'
raw = pd.read_excel(fpath, index_col = 'index')
3. Selection
1) Single value selection
- df.iloc[row,column]: select by index
- df.loc[row,column]: select by name
raw.iloc[1,1] #3
raw.loc[1,'oranges'] #3
2) Multiple value selection
- df.loc[index_name, column_name]
- df.iloc[index_number, column_number]
Put list type data into Index/Column info (slicing)
raw.loc[1, ['apples','oranges']]#list slicing
raw.loc[1, 'apples':]
3) Column Selection
To select the entire single column,
- data.<column_name>
- data[‘<column_name>’]
- data.loc[:, <column_name>]
4) Conditional Data Selection
df[condition] → Only True value data will be printed
- condition: List or series that has a type of True/False
cond = raw['orange'] < 10
print(cond)
# Then it prints the True/False data for each column
5) Multiple conditions
cond = [True, False, True]
raw[cond]
# Then it prints the columns that satisfy the conditions listedcond = (raw['apple'] >= 5) & (raw['orange'] >= 3)
raw[cond]
4. Adding Data
- Add the column data
- df[‘column_name’] = data
- data → single value (same value for all), group (list, pandas series)
5. Merging the data table
# importing the data (index_col = 'index')fpath = './data/exam.xlsx'
A = pd.read_excel(fpath, index_col = 'index')# importing the second data (index_col = 'index')fpath2 = './data/exam_extra.xlsx'
B = pd.read_excel(fpath2, index_col = 'index')pd.merge(A, B, how = "left", left_on = "<column_name>" or left_index = True, right_on = "<column_name>" or right_index = True)
👉 how
- left: data from the left table base
- right: data from the right table base
- inner: data from both
- outer: entire data
6. Saving the merged data
# Merged datatotal = pd.merge(A, B, how = "left", left_index = True, right_index = True)# Saving the data in exam_total.xlsxfpath = './data/exam_total.xlsx'
total.to_excel(fpath)
Pandas data frame always has its index value. We use index = False if we don’t want its index value to be saved.
fpath = './data/exam_total_withoutindex.xlsx'total.to_excel(fpath, index = False)
Cleanup & Aggregation
import pandas as pd# importing datafpath = './data/babyNamesUS.csv'
raw = pd.read_csv(fpath)# see the first five rowsraw.head()# see the data structureraw.info()
Aggregation
df.pivot_table(index = '<column_name>', columns = '<column_name>', values = '<column_name>', aggfunc = 'sum')✔️ aggfunc options: sum, count, mean …
How to fill in the empty space in the data table?
- Common values (ex. 0)
- Temporary values (ex. mean, max, min, or any values around)
- exempting the emptied data
name_df = name_df.fillna(0)Sorting
name_df.sort_values(by = '<column_name>', ascending = False)Check the data types by each column
df['<column>'].unique()
df['<column>'].value_counts()# example by typesraw['StateCode'].unique()>>> array(['AK','AL','AR','AZ','CA','CO], dtype = object)# example by countsraw['StateCode'].value_counts()>>> CA   361128
    AL   128556
    AZ   108599
    CO   101403
    ...